Pinterest (PINS) — Deep Dive
Prices as of the Mon 05 Oct 2026 close · data pulled 2026-10-06 07:32:00+00:00 · refreshed weekly · methodology
Not investment advice
Educational analysis built from public data (Yahoo Finance, Kenneth French Data Library) and explicit model assumptions. Numbers update automatically; the qualitative notes are dated.
Verdict: Accumulate on weakness — 5/8 checks pass
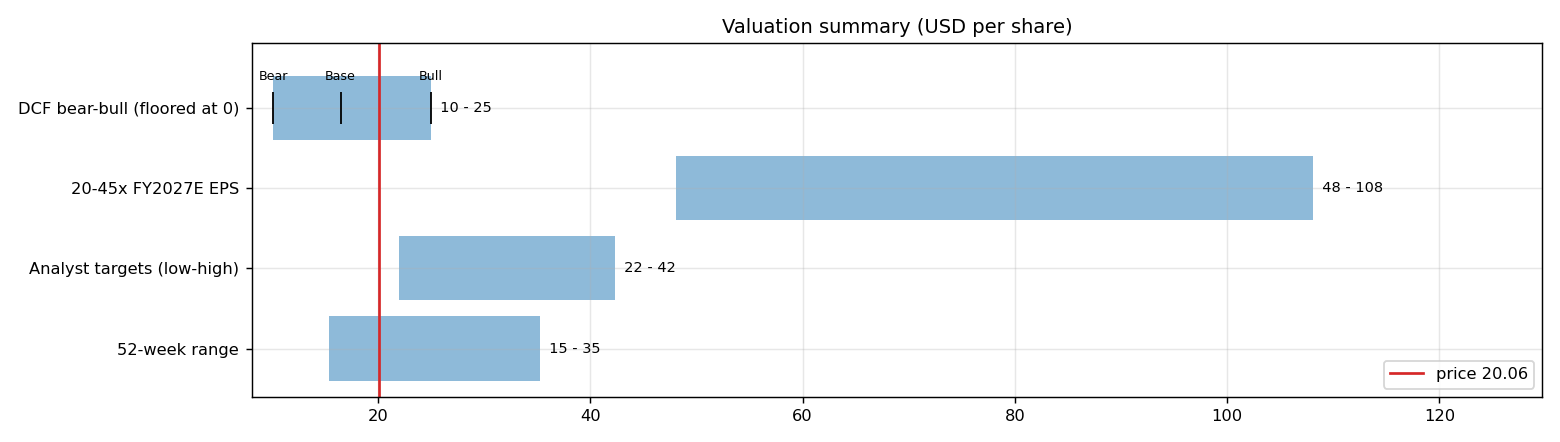
Pinterest is profitable on an owner-FCF basis, with net cash of USD 0.1bn and consensus revenue of 4.9bn for FY2026 and 5.6bn for FY2027 (+13%). At USD 20.06 the market prices in 15% a year revenue growth after FY2027 (fading to 4%) at a 6% owner-FCF margin, or a 7% margin on the base growth path. The base-case DCF is USD 16 (-18%).
| Check | Pass | Evidence |
|---|---|---|
| Valuation: base-case DCF at or above price | ❌ | base DCF USD 16 vs price USD 20 |
| Relative value: forward P/E at most 1.2x the peer median | ✅ | 8.4x FY2027E vs peer median 15.5x |
| Street: de-biased, shrunk analyst alpha > 0 (ch27) | ✅ | +6.5% |
| Momentum: 12-1 month return > 0 (ch11) | ❌ | -35% |
| Trend: price above 200-day MA (ch12) | ❌ | -5% vs 200DMA |
| Not overbought: RSI(14) below 70 | ✅ | RSI 52 |
| Fundamentals: revenue growing and FCF positive | ✅ | revenue +18% y/y, TTM FCF 1.3bn |
| Balance sheet: net cash | ✅ | net cash 0.1bn |
Snapshot
| Metric | Value | Metric | Value |
|---|---|---|---|
| Price | USD 20.06 | Market cap | USD 9.7bn |
| Enterprise value | USD 9.6bn | Net cash | USD 0.1bn |
| 52-week range | 15.42 – 35.24 | From 52w high | -43.1% |
| Trailing P/E (GAAP) | 59.0x | Forward P/E FY2026 / FY2027 | 9.9x / 8.4x |
| PEG (FY+1 P/E ÷ EPS growth) | 0.44 | EV / TTM revenue | 2.1x |
| TTM revenue | USD 4.6bn | TTM FCF / after SBC | 1.3bn / 0.3bn |
| Beta vs SPY (raw / Blume) | 0.89 / 0.92 | Realized vol 20d / 1y | 55% / 55% |
| Analysts / mean target | 35 / USD 29 (+44.8%) | Next earnings | 2026-11-09 |
| Shares out (diluted proxy) | 0.482bn | Short interest (% float) | 15.9% |
| Sector ETF benchmark | XLC | Cash runway (cash ÷ FCF burn) | n/a (FCF positive) |
| Institutions / insiders | 108% / 1.32% | Dividend | none |
1. Price over time
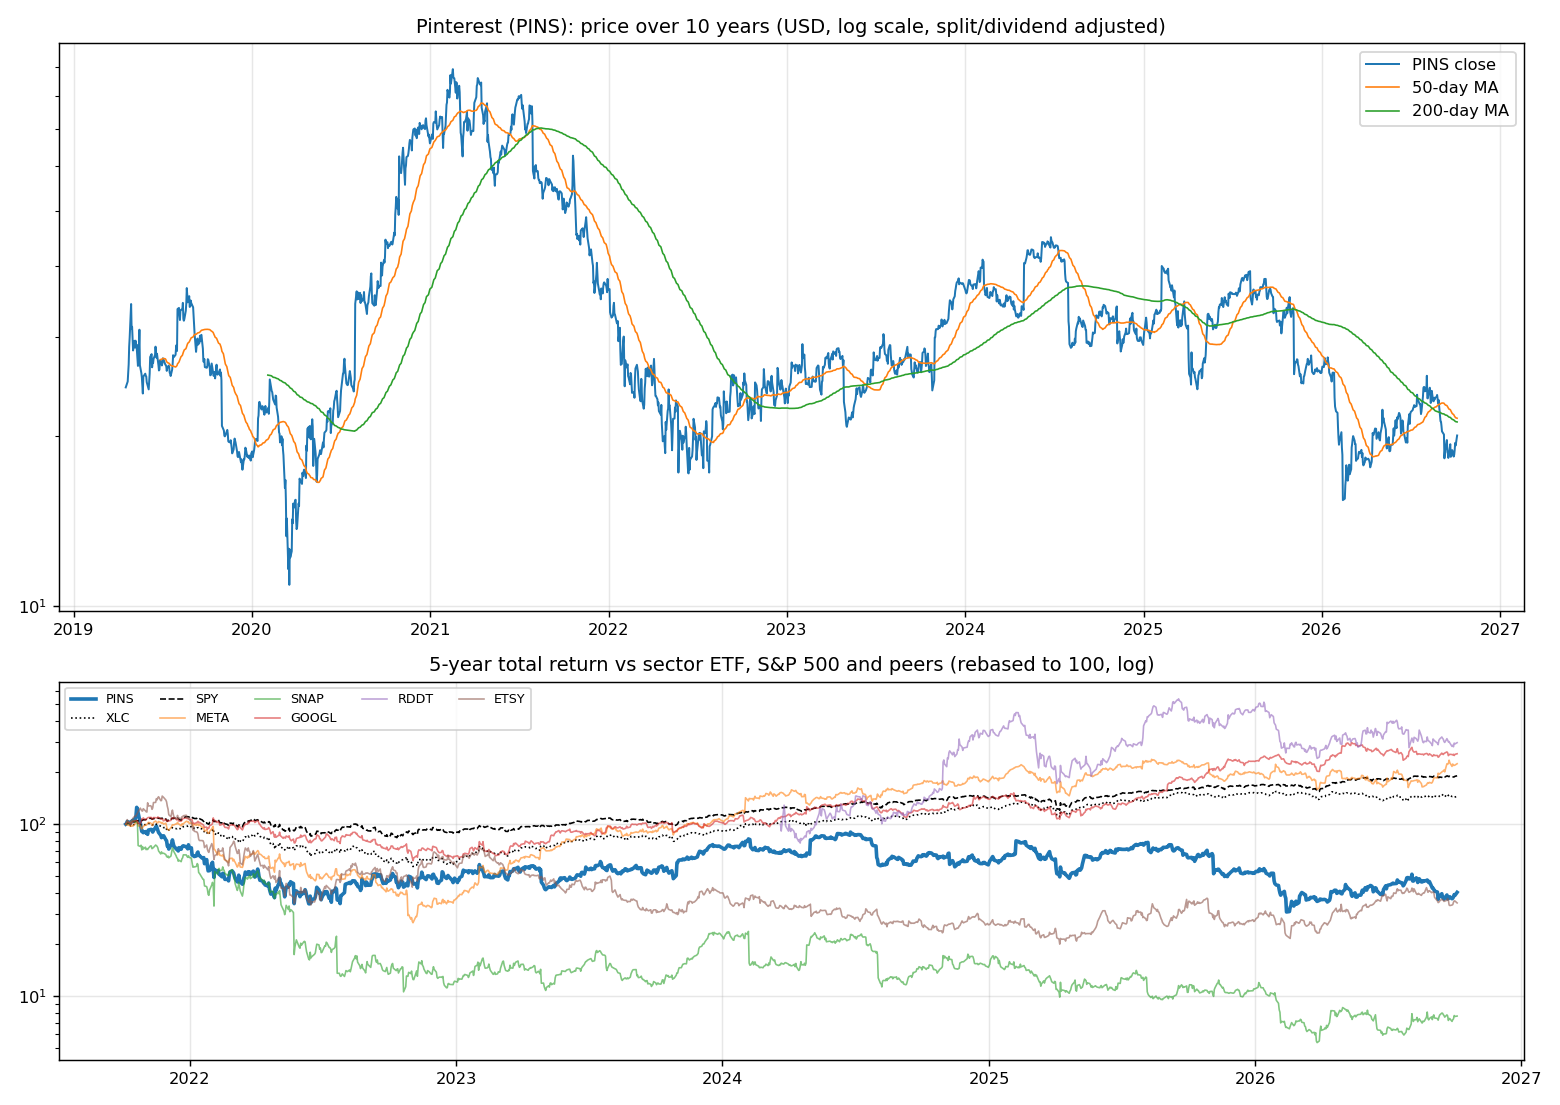
| Ticker | 1M | 3M | 6M | YTD | 1Y | 3Y | 5Y | 10Y | 10Y CAGR |
|---|---|---|---|---|---|---|---|---|---|
| PINS | -2% | -10% | +10% | -23% | -37% | -29% | -60% | n/a | n/a |
| XLC | -0% | +2% | +0% | -4% | -3% | +73% | +45% | n/a | n/a |
| SPY | +1% | +3% | +18% | +15% | +17% | +87% | +91% | +321% | 15.5% |
| META | +20% | +24% | +30% | +13% | +5% | +137% | +125% | +483% | 19.3% |
| SNAP | +3% | +18% | +19% | -30% | -34% | -35% | -92% | n/a | n/a |
| GOOGL | +2% | -5% | +16% | +11% | +42% | +154% | +157% | +773% | 24.2% |
| RDDT | -3% | -25% | +9% | -35% | -27% | n/a | n/a | n/a | n/a |
| ETSY | -7% | -6% | +30% | +28% | -2% | +13% | -65% | +362% | 16.5% |
Largest one-day moves in the last 5 years: 24 May 2022 -23.6%, 05 Nov 2025 -21.8%, 01 May 2024 +21.0%, 13 Feb 2026 -16.8%, 07 Feb 2025 +19.1%.
2. Return and risk (ch.5)
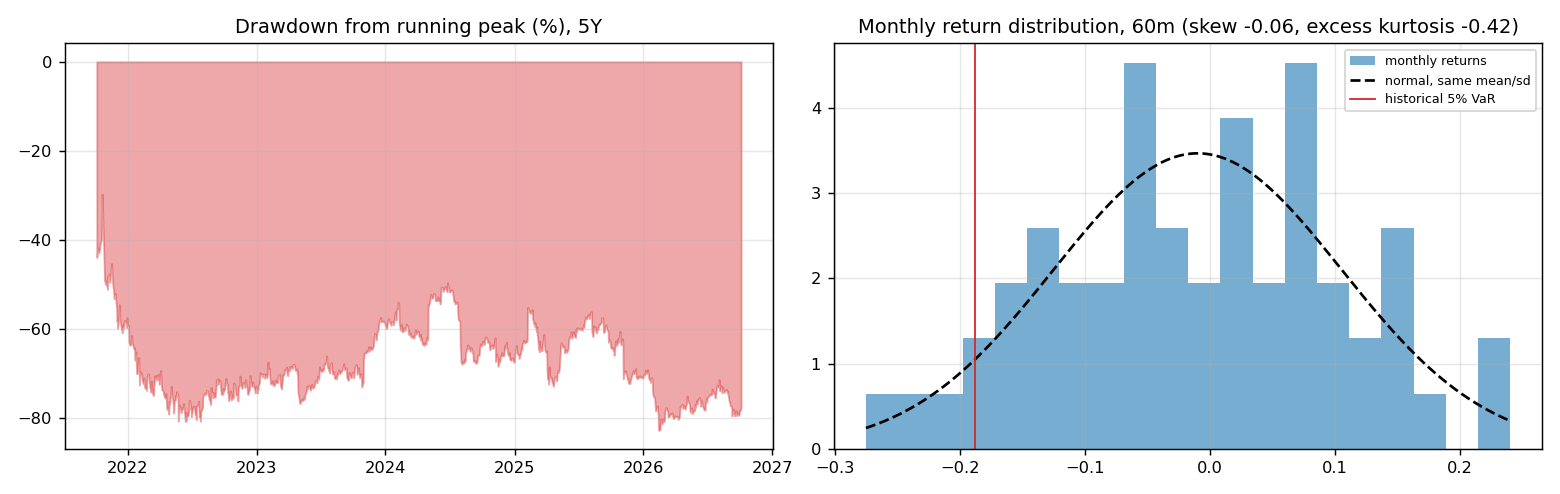
Statistics use the 60 complete months to Sep 2026.
| Statistic | Value | What it means |
|---|---|---|
| Arithmetic mean (annualized) | -11.6% | Expected one-period return if the past repeats |
| Geometric mean (CAGR) | -18.0% | What a buy-and-hold investor actually earned; the gap ≈ σ²/2 is volatility drag |
| Standard deviation (annualized) | 39.9% | 2.5× the S&P 500's 15.7% |
| Skewness / excess kurtosis | -0.06 / -0.42 | Left-skewed, thin tails vs normal |
| 5% monthly VaR: historical / normal | -18.8% / -19.9% | One month in 20 loses at least this much |
| 5% monthly expected shortfall | -23.7% | Average loss in that worst 5% of months |
| Sharpe ratio (S&P 500) | -0.38 (0.67) | Excess return per unit of total risk |
| Sortino ratio | -0.50 | Excess return per unit of downside risk |
| Max drawdown, 5y | -82.7% (trough Feb 2026) | Currently -77.5% from the peak |
3. Index model, CAPM and factors (ch.8–10)
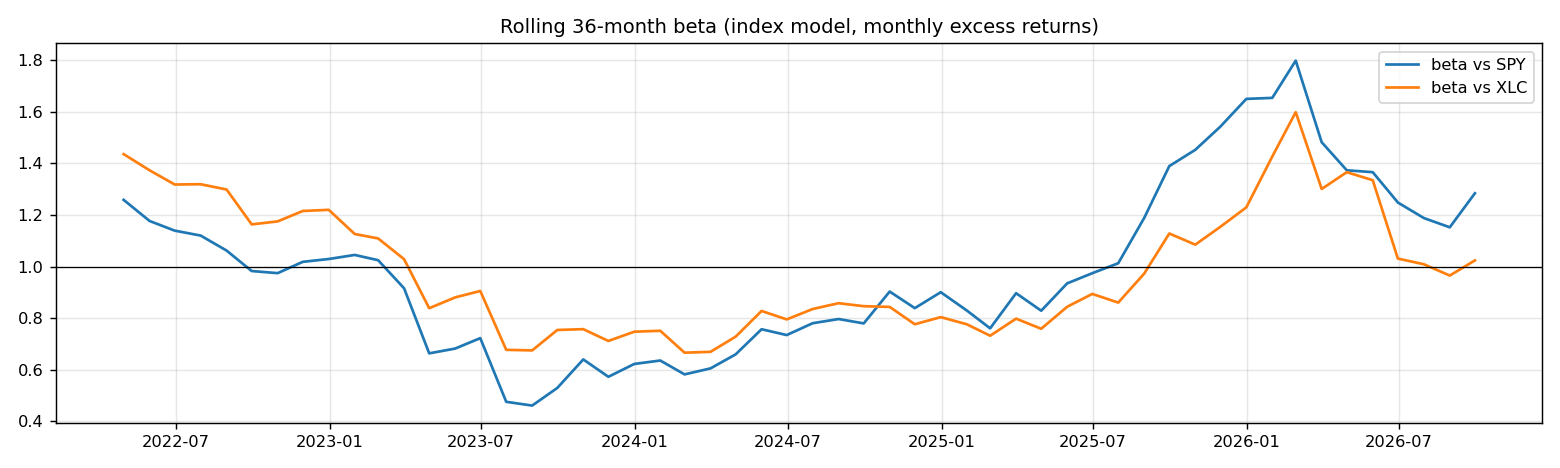
| Regression (60m excess returns) | Alpha (ann.) | t(α) | Beta | t(β) | R² | Residual σ |
|---|---|---|---|---|---|---|
| vs SPY | -24.6% | -1.43 | 0.89 | 2.82 | 0.12 | 37.3% |
| vs XLC | -19.8% | -1.19 | 0.81 | 3.04 | 0.14 | 36.9% |
- Risk decomposition (ch.8): systematic variance β²σ²(M) = 1.9% vs firm-specific σ²(e) = 13.9%, so 12% of the risk is market-driven and 88% is diversifiable.
- CAPM required return (ch.9): k = r_f + β × MRP = 4.02% + 0.89 × 5.5% = 8.9% (Blume-adjusted β 0.92 → 9.1%, used as the DCF discount rate).
- Historical alpha of -24.6% a year has a t-stat of -1.43: not statistically distinguishable from zero (ch.11: past alpha is a weak guide).
- Fama-French 5 factors + momentum (ch.10, 87 months to Jul 2026): R² 0.16, alpha -4.4% (t -0.23). Loadings: Mkt-RF +1.02 (t 3.0), SMB +0.12 (t 0.2), HML -0.36 (t -0.7), RMW -0.38 (t -0.6), CMA -0.25 (t -0.3), Mom -0.02 (t -0.1). The loadings describe a size-neutral, growth, low-profitability return profile (SMB > 0 small-cap, HML < 0 growth, RMW < 0 weak profitability, CMA < 0 aggressive investment).
4. Portfolio fit: allocation and diversification (ch.6–7)
Correlation of monthly returns with PINS (60m): XLC 0.38, SPY 0.36, META 0.30, SNAP 0.44, GOOGL 0.18, RDDT 0.21, ETSY 0.30.
- A 50/50 mix with SPY would have had volatility of 23.9% vs 27.8% for the weighted average of the two, a diversification benefit because ρ = 0.36 < 1.
- Optimal risky share y* = [E(r) − r_f] / (A·σ²), holding PINS alone against T-bills (σ = 39.9%):
| Risk aversion A | y* with CAPM E(r) | y* with E(r) + Street α |
|---|---|---|
| 2 | 15% | 36% |
| 3 | 10% | 24% |
| 4 | 8% | 18% |
| 6 | 5% | 12% |
Even a risk-tolerant investor would put only a modest share in a single stock this volatile. Ch.7–8 say the efficient choice is the market portfolio plus a Treynor-Black tilt (section 9), not a concentrated position.
5. Financial statements: quality of earnings (ch.19)
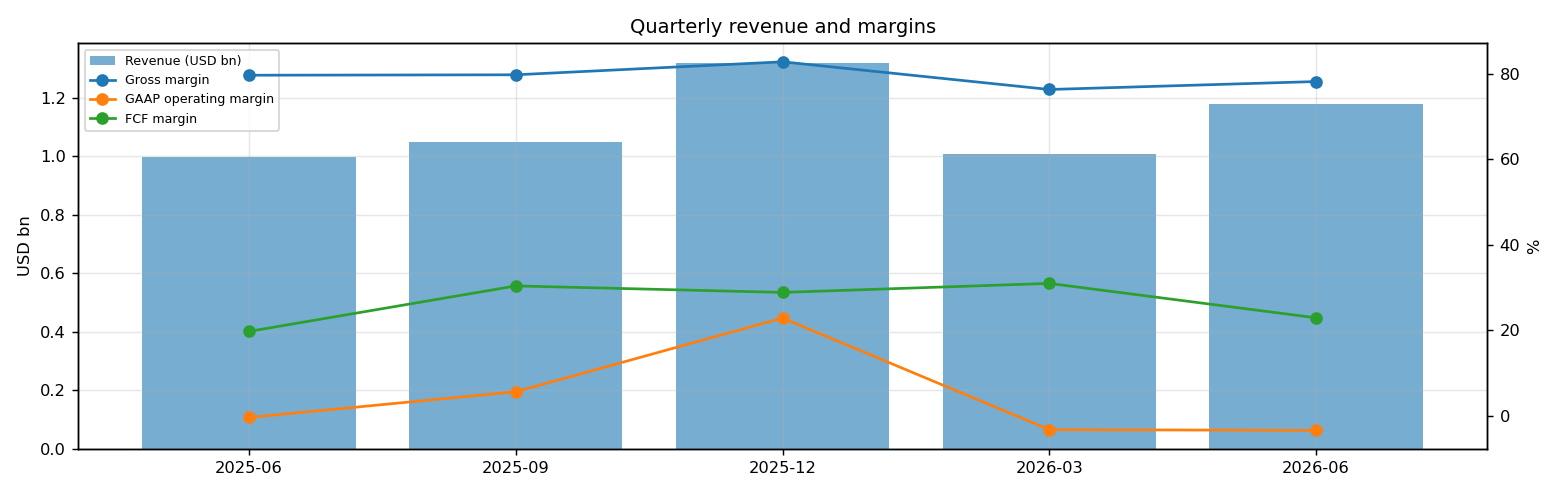
| Quarter | Revenue | Q/Q | Gross m. | Op. m. (GAAP) | Net m. | R&D % | SBC % | Diluted EPS | FCF | FCF m. | DSO (days) | DIO (days) |
|---|---|---|---|---|---|---|---|---|---|---|---|---|
| 2025-06 | 1.0bn | n/a | 79.7% | -0.4% | 3.9% | 36.0% | 22.8% | 0.06 | 0.20bn | 19.7% | 69 | n/a |
| 2025-09 | 1.0bn | +5% | 79.8% | 5.6% | 8.8% | 35.4% | 22.4% | 0.13 | 0.32bn | 30.3% | 69 | n/a |
| 2025-12 | 1.3bn | +26% | 82.8% | 22.8% | 21.0% | 27.7% | 17.5% | 0.41 | 0.38bn | 28.8% | 69 | n/a |
| 2026-03 | 1.0bn | -24% | 76.3% | -3.3% | -7.3% | 37.8% | 23.0% | -0.12 | 0.31bn | 30.9% | 75 | n/a |
| 2026-06 | 1.2bn | +17% | 78.2% | -3.5% | -4.0% | 38.2% | 27.5% | -0.08 | 0.27bn | 22.9% | 72 | n/a |
- DuPont, TTM: ROE 6.2% = net margin 5.5% × asset turnover 0.88 × leverage 1.28. Relative to typical levels (10% margin, 0.8 turnover, 2.0 leverage) the biggest driver is asset turnover.
- Cash conversion: TTM operating cash flow 1.3bn vs net income 0.2bn. The accruals ratio of -21.0% of assets is negative (cash earnings exceed accounting earnings), a sign of high-quality earnings.
- Stock-based compensation of 1.0bn TTM (22.4% of revenue) is a real cost to shareholders. The valuation below uses FCF after SBC (owner FCF margin 5.7%). Buybacks were 3.1bn; share count changed -16.8% over the year.
- Operating leverage (ch.17): degree of operating leverage 4.93 (last two fiscal years): each 1% change in sales moved EBIT by about 4.9%.
6. Valuation (ch.18)
Multiples vs peers (Yahoo Finance, TTM and next-year; peers chosen by hand in config.json):
| Ticker | Fwd P/E | P/S TTM | EV/EBITDA | FCF yield | Rev. growth FY | Gross m. | EBIT m. | ROE TTM | Target upside |
|---|---|---|---|---|---|---|---|---|---|
| PINS | 8.4x | 2.5x | 35.6x | 11% | 18% | 79% | -3% | 6% | 45% |
| META | 21.3x | 8.3x | 17.4x | 1% | 28% | 82% | 35% | 30% | 7% |
| SNAP | 7.2x | 1.5x | -75.6x | 8% | 19% | 57% | -3% | -16% | 32% |
| GOOGL | 23.0x | 9.5x | 23.9x | 1% | 24% | 61% | 34% | 49% | 24% |
| RDDT | 15.5x | 10.4x | 32.7x | 2% | 61% | 91% | 29% | 31% | 42% |
| ETSY | 10.3x | 2.2x | 18.0x | 3% | 6% | 71% | 19% | n/a | 25% |
| Peer median | 15.5x | 8.3x | 18.0x | 2% | 24% | 71% | 29% | 30% | 25% |
Growth embedded in the price (PVGO). With FY2027E EPS of USD 2.40 and k = 9.1%, the no-growth value E₁/k is USD 26.40. PVGO = USD -6.34, which is -32% of the price: the price is below the no-growth value, so the market expects earnings to shrink or doubts their durability. No-growth P/E = 1/k = 11.0x vs the actual 8.4x.
Constant-growth check. On TTM owner FCF, P = FCF₁/(k − g) implies a perpetual growth rate of 6.3%, above the 4% long-run nominal-GDP ceiling the book recommends for g.
Scenario DCF (owner FCF, k = 9.1%, terminal g = 4%). The revenue path is FY2026 (4.9bn), then the FY2027 low/avg/high estimate, then growth that fades linearly to 4% over 8 years. Owner-FCF margin ramps from today's 5.7% to the scenario margin over 3 years. Scenario assumptions are generic (derived from consensus growth and today's owner-FCF margin).
| Scenario | FY2027 revenue | Growth after | Owner-FCF margin | FY2035 revenue | Terminal value share | Value / share | vs price |
|---|---|---|---|---|---|---|---|
| Bear | 5.3bn | 5% | 4% | 8bn | 64% | USD 10 | -50% |
| Base | 5.6bn | 10% | 6% | 10bn | 67% | USD 16 | -18% |
| Bull | 5.7bn | 15% | 7% | 12bn | 69% | USD 25 | +25% |
Reverse DCF: what today's price assumes. On the base revenue path the price requires a steady-state owner-FCF margin of 7%. At the base 6% margin it requires 15% growth after FY2027, or a discount rate of 8.2% (vs the model's 9.1%).
Sensitivity: base revenue path, value per share by discount rate (rows) and steady-state owner-FCF margin (columns).
| k \ margin | 3% | 5% | 6% | 7% | 8% |
|---|---|---|---|---|---|
| 6.1% | 22 | 35 | 42 | 49 | 56 |
| 7.1% | 15 | 24 | 29 | 33 | 38 |
| 8.1% | 11 | 18 | 22 | 25 | 28 |
| 9.1% | 9 | 15 | 17 | 20 | 23 |
| 10.1% | 8 | 12 | 14 | 17 | 19 |
Earnings-multiple cross-check: FY2027E EPS USD 2.40 × 20x = 48, 25x = 60, 30x = 72, 35x = 84, 40x = 96, 45x = 108. The price implies 8x. The FY2027 EPS range across analysts is 2.06–2.81.
7. Market efficiency and earnings reactions (ch.11)
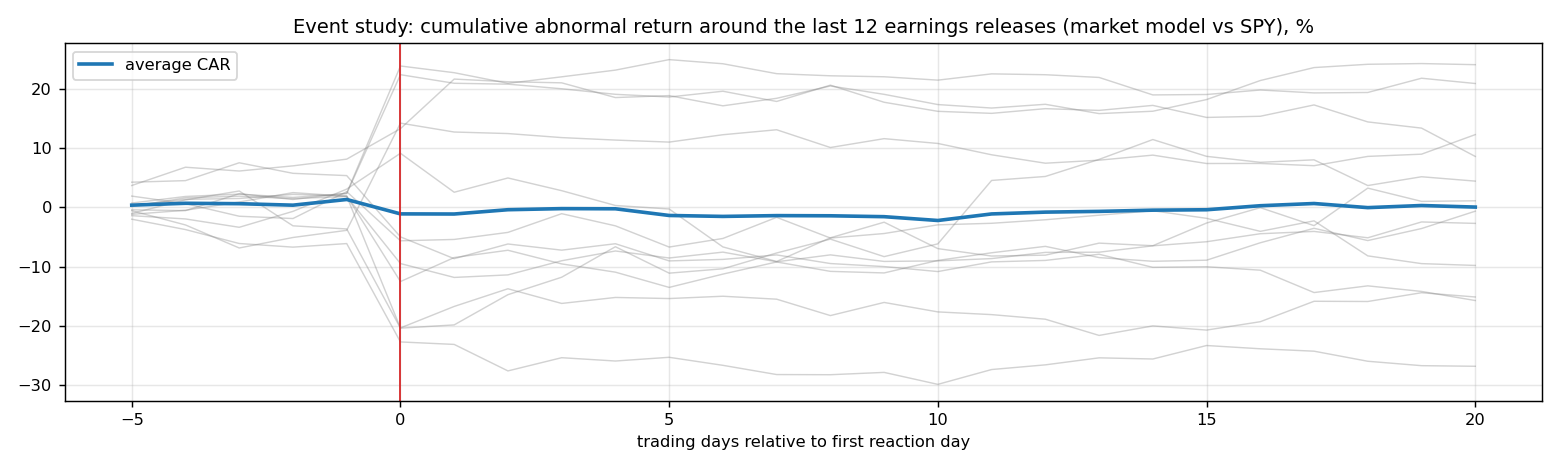
Market-model abnormal returns (vs SPY, estimated over the 250 days before each event) for the last 12 releases:
| Announced | Reaction day | EPS vs est. | Surprise | AR day 0 | CAR [−1,+1] | Drift CAR [+2,+20] |
|---|---|---|---|---|---|---|
| 2026-08-04 | 2026-08-05 | 0.43 vs 0.36 | 20.4% | -8.3% | -3.5% | -4.4% |
| 2026-05-04 | 2026-05-05 | 0.27 vs 0.22 | 24.7% | +6.0% | +3.2% | -1.4% |
| 2026-02-12 | 2026-02-13 | 0.67 vs 0.67 | -0.7% | -16.7% | -16.7% | +24.3% |
| 2025-11-04 | 2025-11-05 | 0.38 vs 0.42 | -8.8% | -22.2% | -19.2% | +1.6% |
| 2025-08-07 | 2025-08-08 | 0.33 vs 0.35 | -6.2% | -11.3% | -13.3% | +9.1% |
| 2025-05-08 | 2025-05-09 | 0.23 vs 0.26 | -9.8% | +5.1% | +14.6% | +2.4% |
| 2025-02-06 | 2025-02-07 | 0.56 vs 0.65 | -13.4% | +20.1% | +19.3% | -12.3% |
| 2024-11-07 | 2024-11-08 | 0.40 vs 0.34 | 16.3% | -14.4% | -10.7% | +7.8% |
| 2024-07-30 | 2024-07-31 | 0.29 vs 0.28 | 4.2% | -16.6% | -16.4% | -3.7% |
| 2024-04-30 | 2024-05-01 | 0.20 vs 0.13 | 48.8% | +21.4% | +21.4% | -1.8% |
| 2024-02-08 | 2024-02-09 | 0.53 vs 0.51 | 3.4% | -10.3% | -14.4% | -7.1% |
| 2023-10-30 | 2023-10-31 | 0.28 vs 0.20 | 40.4% | +18.1% | +17.8% | -0.4% |
- Average absolute day-0 abnormal move: 14.2%. The sign of the EPS surprise matched the sign of the reaction 50% of the time, which is close to a coin flip: guidance and commentary matter more than the headline EPS beat.
- Post-announcement drift: the correlation between the initial reaction and the next-20-day drift is -0.43. There is no reliable post-earnings drift, consistent with semi-strong efficiency.
8. Technicals and behavioural signals (ch.12)
| Indicator | Value | Read |
|---|---|---|
| Price vs 50-day / 200-day MA | -7% / -5% | Golden cross (50 > 200) |
| RSI(14) | 52 | Neutral |
| 12-1 month momentum | -35% | Negative (Jegadeesh-Titman) |
| 6-month relative strength vs XLC | +9% | Leader |
| Insider sales / purchases, last 6m | USD 0.04bn / USD 0.00bn | Net selling, often planned 10b5-1 sales; insider buying is the informative signal (ch.11) |
| Analyst actions, last 90 days | 15 actions, 12 target raises | Targets chasing the price is a sign of anchoring and herding (ch.12) |
| Recent targets below current price | 0% | Most targets still sit above the price |
| Ratings (strong buy / buy / hold / sell) | 2 / 17 / 19 / 0 | Mixed views: less crowded positioning |
| FY2027 EPS estimate: now vs 90 days ago | 2.40 vs 2.23 | +8% revision; up/down revisions in the last 30 days: 3/0 |
9. Treynor-Black: should an active manager overweight it? (ch.27)
| Step | Value |
|---|---|
| Analyst-implied 12m return (mean target / price − 1) | +44.8% |
| CAPM 1-year required return (raw β) | 8.9% |
| Raw alpha | +35.9% |
| Minus average analyst optimism bias (Top-30 cross-section) | -9.9% |
| Shrunk alpha (× 0.25, for forecast imprecision) | +6.5% |
| Residual variance σ²(e) | 13.9% |
| Initial active weight w₀ = [α/σ²(e)] / [E(R_M)/σ²_M] | +20.9% |
| Beta-adjusted weight w* = w₀ / [1 + (1 − β)w₀] | +20.4% |
A positive weight means an active manager would hold more than its index weight.
10. Options market view (ch.20–21)
| Expiry | Days | ATM IV | Implied ±1σ move to expiry | 90% put − 110% call IV (skew) |
|---|---|---|---|---|
| 2026-10-16 | 11 | 63% | ±11.0% (±2) | +3.3% |
| 2026-10-23 | 18 | 58% | ±12.9% (±3) | +4.2% |
| 2026-10-30 | 25 | 77% | ±20.0% (±4) | +3.8% |
| 2026-11-06 | 32 | 62% | ±18.4% (±4) | +6.9% |
| 2026-11-13 | 39 | 72% | ±23.6% (±5) | +17.5% |
| 2026-11-20 | 46 | 61% | ±21.7% (±4) | +3.6% |
| 2026-12-18 | 74 | 57% | ±25.5% (±5) | +5.8% |
| 2027-01-15 | 102 | 56% | ±29.3% (±6) | +11.0% |
| 2027-02-19 | 137 | 57% | ±34.6% (±7) | +5.1% |
| 2027-03-19 | 165 | 56% | ±37.5% (±8) | +11.8% |
| 2027-05-21 | 228 | 56% | ±44.3% (±9) | +15.7% |
| 2027-06-17 | 255 | 56% | ±46.6% (±9) | +19.2% |
| 2027-09-17 | 347 | 57% | ±55.5% (±11) | +10.3% |
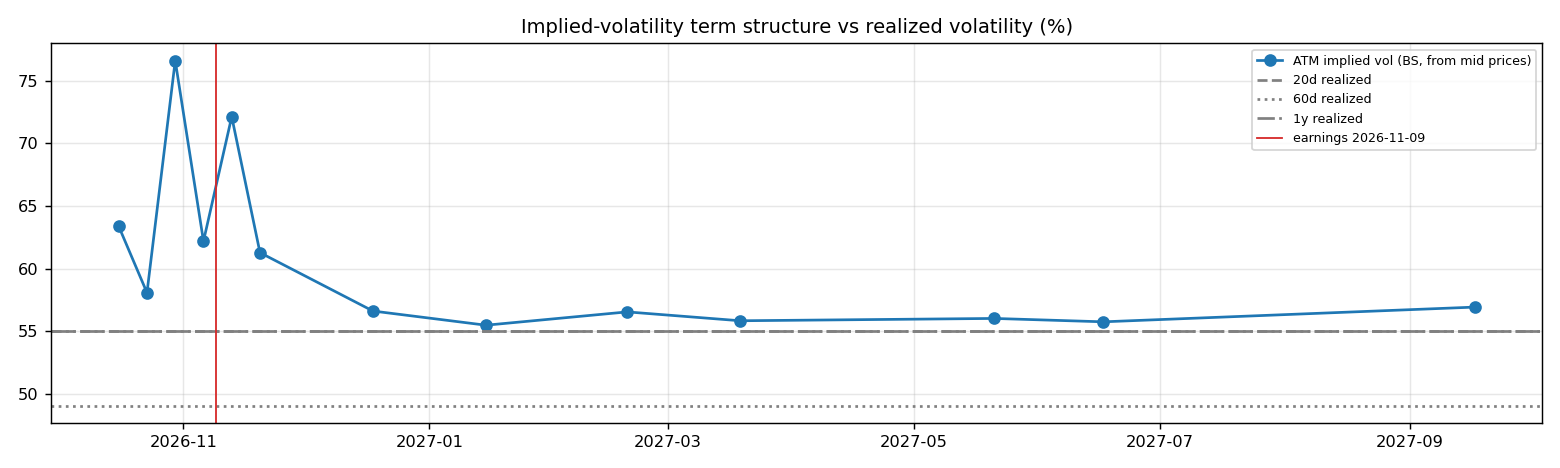
- Earnings-implied move: the jump in variance from the 2026-11-06 expiry (IV 62%) to 2026-11-13 (IV 72%) prices an earnings-day move of ±11.9% (1σ), or about ±9.5% in absolute terms (≈ ±2). Compare the historical average absolute reaction of 14.2% in section 7.
- Implied vs realized: the ~1-month ATM IV is 62% vs realized 55% (20d) / 49% (60d) / 55% (1y). Options are rich relative to realized volatility, which favours premium sellers (covered calls, cash-secured puts).
- Put-call parity (ch.20): at the ATM strike for 2026-11-06, C − P − (S − PV(K)) = -0.26 per share. A small gap reflects bid/ask spreads, the hard-to-borrow cost and early-exercise value of American options.
- Quotes were unavailable when the data was pulled (outside market hours), so implied vols use each contract's last trade price. Treat them as approximate; illiquid strikes can be stale.
Premium-selling menu for holders: the last expiry before earnings (2026-11-06), about 0.15/0.20/0.25/0.30 delta.
| Type | Strike | Bid / Ask | Price | IV | Delta | P(expires OTM) | Distance | Yield | Annualized | OI |
|---|---|---|---|---|---|---|---|---|---|---|
| Call | 22 | – | 0.55 | 57% | +0.28 | 77% | +12.2% | 2.74% | 31% | – |
| Call | 23 | – | 0.50 | 60% | +0.25 | 80% | +14.7% | 2.49% | 28% | – |
| Call | 24 | – | 0.39 | 59% | +0.21 | 83% | +17.1% | 1.94% | 22% | – |
| Call | 24 | – | 0.26 | 55% | +0.16 | 88% | +19.6% | 1.30% | 15% | – |
| Put | 17.0 | – | 0.36 | 64% | -0.16 | 79% | -15.3% | 2.12% | 24% | – |
| Put | 17.5 | – | 0.35 | 56% | -0.18 | 77% | -12.8% | 2.00% | 23% | – |
| Put | 18.0 | – | 0.63 | 65% | -0.25 | 69% | -10.3% | 3.50% | 40% | – |
| Put | 18.5 | – | 0.80 | 65% | -0.30 | 63% | -7.8% | 4.32% | 49% | – |
Calls = covered calls on shares you own (yield on the share price); puts = cash-secured puts (yield on the strike). Prices are last trades at the data pull and indicative only; check live quotes before trading.
11. Our hourly signal model
PINS is not in the Top-30 signal universe.
12. Qualitative analysis: business, PEST, catalysts and risks
Qualitative notes reviewed 2026-10-06
These notes are written by hand, unlike the auto-refreshed numbers above. Events up to late 2025 come from company announcements. Later developments are inferred from the data (consensus estimates, price reactions) and should be checked against PINS's 10-Q/10-K filings and earnings calls.
Business in one paragraph
Pinterest is a visual discovery and shopping platform where users plan purchases, projects, travel, home design, fashion and events. The business is mostly advertising: promoted pins, shopping ads, video, search-like placements and catalog-driven formats sold to brands, retailers and agencies. Its competitive position is different from pure social media because user intent is often commercial and evergreen rather than conversational, but it still competes with Meta, TikTok, Google, Amazon and retailer media networks for budgets. The investment case hinges on Pinterest converting high-intent, brand-safe engagement into lower-funnel ad dollars, while AI recommendations and third-party ad demand lift monetization outside the US.
Key developments
| When | Event | Why it matters |
|---|---|---|
| 2023-2024 | Amazon Ads demand began ramping on Pinterest, followed by broader third-party demand work including Google. | Third-party demand can fill international inventory and improve auction density without Pinterest rebuilding every advertiser relationship itself. |
| 2024 | Performance+ and other automation tools pushed Pinterest deeper into lower-funnel advertising. | The platform needs measurable conversion outcomes to win budgets beyond brand inspiration. |
| 2024-2025 | Monthly active users moved above the half-billion mark, with Gen Z a growing share of engagement. | Scale and younger cohorts improve the pitch to retailers, but monetization per user still lags larger peers. |
| 2025 | AI-powered shopping features, collages and trend tools expanded across advertiser and user products. | AI can connect inspiration to purchase and reduce creative friction for merchants. |
| 2025 | Management continued emphasizing margin discipline while investing in AI infrastructure. | Pinterest must prove that better recommendation systems can raise revenue faster than costs. |
PEST analysis
| Factor | Tailwinds | Headwinds | Net |
|---|---|---|---|
| Political | Pinterest's brand-safe, less-news-oriented environment is attractive when advertisers avoid controversial platforms. | Privacy regulation, data-transfer rules and antitrust attention on ad-tech partners can affect targeting and measurement. | ⚖️ |
| Economic | Retailers value high-intent discovery when consumer demand is healthy; automation can attract smaller advertisers. | Discretionary categories such as home, apparel and travel are cyclical, and retailer ad budgets can shift to Amazon, Walmart or Google. | ⚖️ |
| Social | Users come to plan purchases and life events, which creates commercial intent without relying on outrage-driven feeds. | Social commerce trends change quickly; younger users may discover products on TikTok, Instagram or YouTube before Pinterest. | ✅ |
| Technological | Visual search, generative creative tools, catalogs and recommendation models can improve relevance and conversion. | Larger platforms have more data, cloud scale and closed-loop commerce signals. Dependence on app stores and ad partners adds platform risk. | ⚖️ |
Bull case vs bear case
- Bull: Pinterest becomes a scaled visual shopping layer: AI improves recommendations, ad partners deepen demand, and retailers see conversion data strong enough to move budgets from social awareness to full-funnel campaigns. International ARPU has room to compound from a low base.
- Bear: User growth remains real but under-monetized, third-party demand proves lower quality than owned demand, and shoppers complete transactions elsewhere. If AI costs rise faster than ad yield, margin expansion could stall.
Catalysts to watch (next 6–12 months)
- International ARPU and whether Amazon/Google demand continues to lift auction density.
- Adoption of Performance+ and catalog-shopping formats by retailers and SMBs.
- Evidence that Gen Z engagement is becoming durable shopping intent, not just saving and browsing.
- Operating margin trends as AI infrastructure and product investment increase.
- Any new commerce integrations that shorten the path from pin to purchase.
What would change the verdict
- More constructive: sustained double-digit revenue growth with expanding margins, stronger advertiser commentary on conversion, and clear evidence that AI shopping products increase purchase intent.
- More cautious: slowing MAU growth, weak international monetization, rising traffic-acquisition or infrastructure costs, or signs that retailer media networks are crowding Pinterest out of performance budgets.
Generated by analyses/deep-dives/deep_dive.py. Quantitative sections refresh weekly; the qualitative notes carry their own review date.