RTX Corporation (RTX) — Deep Dive
Prices as of the Mon 05 Oct 2026 close · data pulled 2026-10-06 07:32:00+00:00 · refreshed weekly · methodology
Not investment advice
Educational analysis built from public data (Yahoo Finance, Kenneth French Data Library) and explicit model assumptions. Numbers update automatically; the qualitative notes are dated.
Verdict: Accumulate on weakness — 5/8 checks pass
RTX Corporation is profitable on an owner-FCF basis, with net debt of USD 30.6bn and consensus revenue of 96.2bn for FY2026 and 103.3bn for FY2027 (+7%). At USD 184.33 the base-case DCF of USD 278 (+51%) sits above the price; on the base growth path the price needs only a 7% owner-FCF margin (base case 10%).
| Check | Pass | Evidence |
|---|---|---|
| Valuation: base-case DCF at or above price | ✅ | base DCF USD 278 vs price USD 184 |
| Relative value: forward P/E at most 1.2x the peer median | ❌ | 23.5x FY2027E vs peer median 17.8x |
| Street: de-biased, shrunk analyst alpha > 0 (ch27) | ✅ | +2.8% |
| Momentum: 12-1 month return > 0 (ch11) | ✅ | +23% |
| Trend: price above 200-day MA (ch12) | ❌ | -5% vs 200DMA |
| Not overbought: RSI(14) below 70 | ✅ | RSI 24 |
| Fundamentals: revenue growing and FCF positive | ✅ | revenue +14% y/y, TTM FCF 11.0bn |
| Balance sheet: net cash | ❌ | net cash -30.6bn |
Snapshot
| Metric | Value | Metric | Value |
|---|---|---|---|
| Price | USD 184.33 | Market cap | USD 248.4bn |
| Enterprise value | USD 279.0bn | Net cash | USD -30.6bn |
| 52-week range | 154.70 – 225.49 | From 52w high | -18.3% |
| Trailing P/E (GAAP) | 32.5x | Forward P/E FY2026 / FY2027 | 25.4x / 23.5x |
| PEG (FY+1 P/E ÷ EPS growth) | 2.77 | EV / TTM revenue | 3.0x |
| TTM revenue | USD 93.5bn | TTM FCF / after SBC | 11.0bn / 9.8bn |
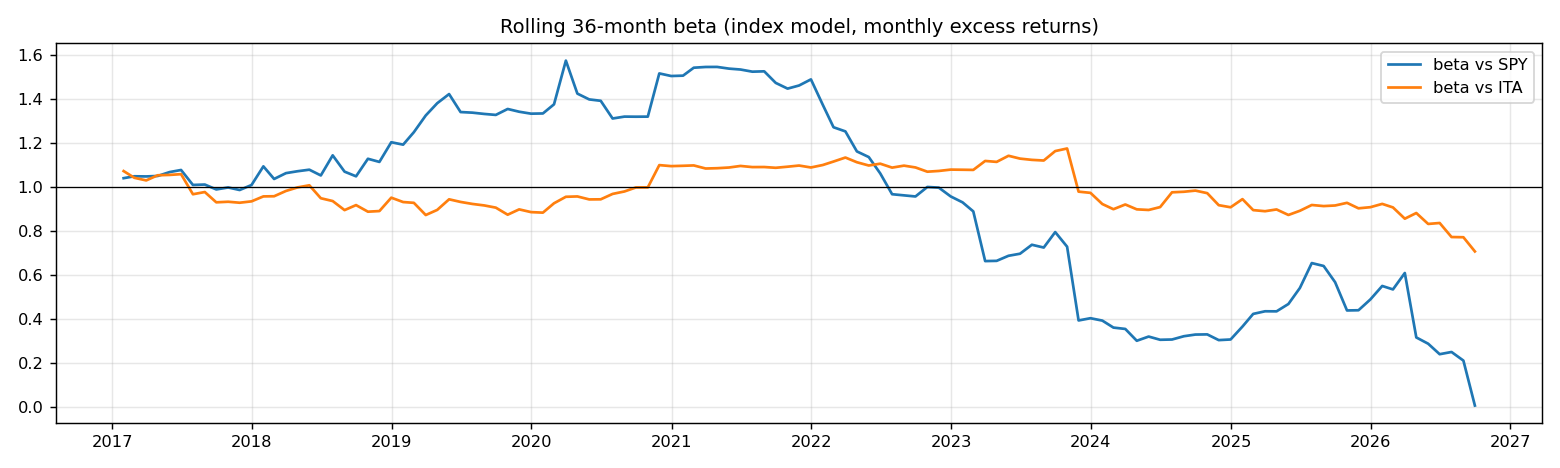
| Beta vs SPY (raw / Blume) | 0.31 / 0.54 | Realized vol 20d / 1y | 12% / 26% |
| Analysts / mean target | 22 / USD 234 (+27.0%) | Next earnings | 2026-10-20 |
| Shares out (diluted proxy) | 1.348bn | Short interest (% float) | 1.0% |
| Sector ETF benchmark | ITA | Cash runway (cash ÷ FCF burn) | n/a (FCF positive) |
| Institutions / insiders | 82% / 0.09% | Dividend | USD 2.92 |
1. Price over time
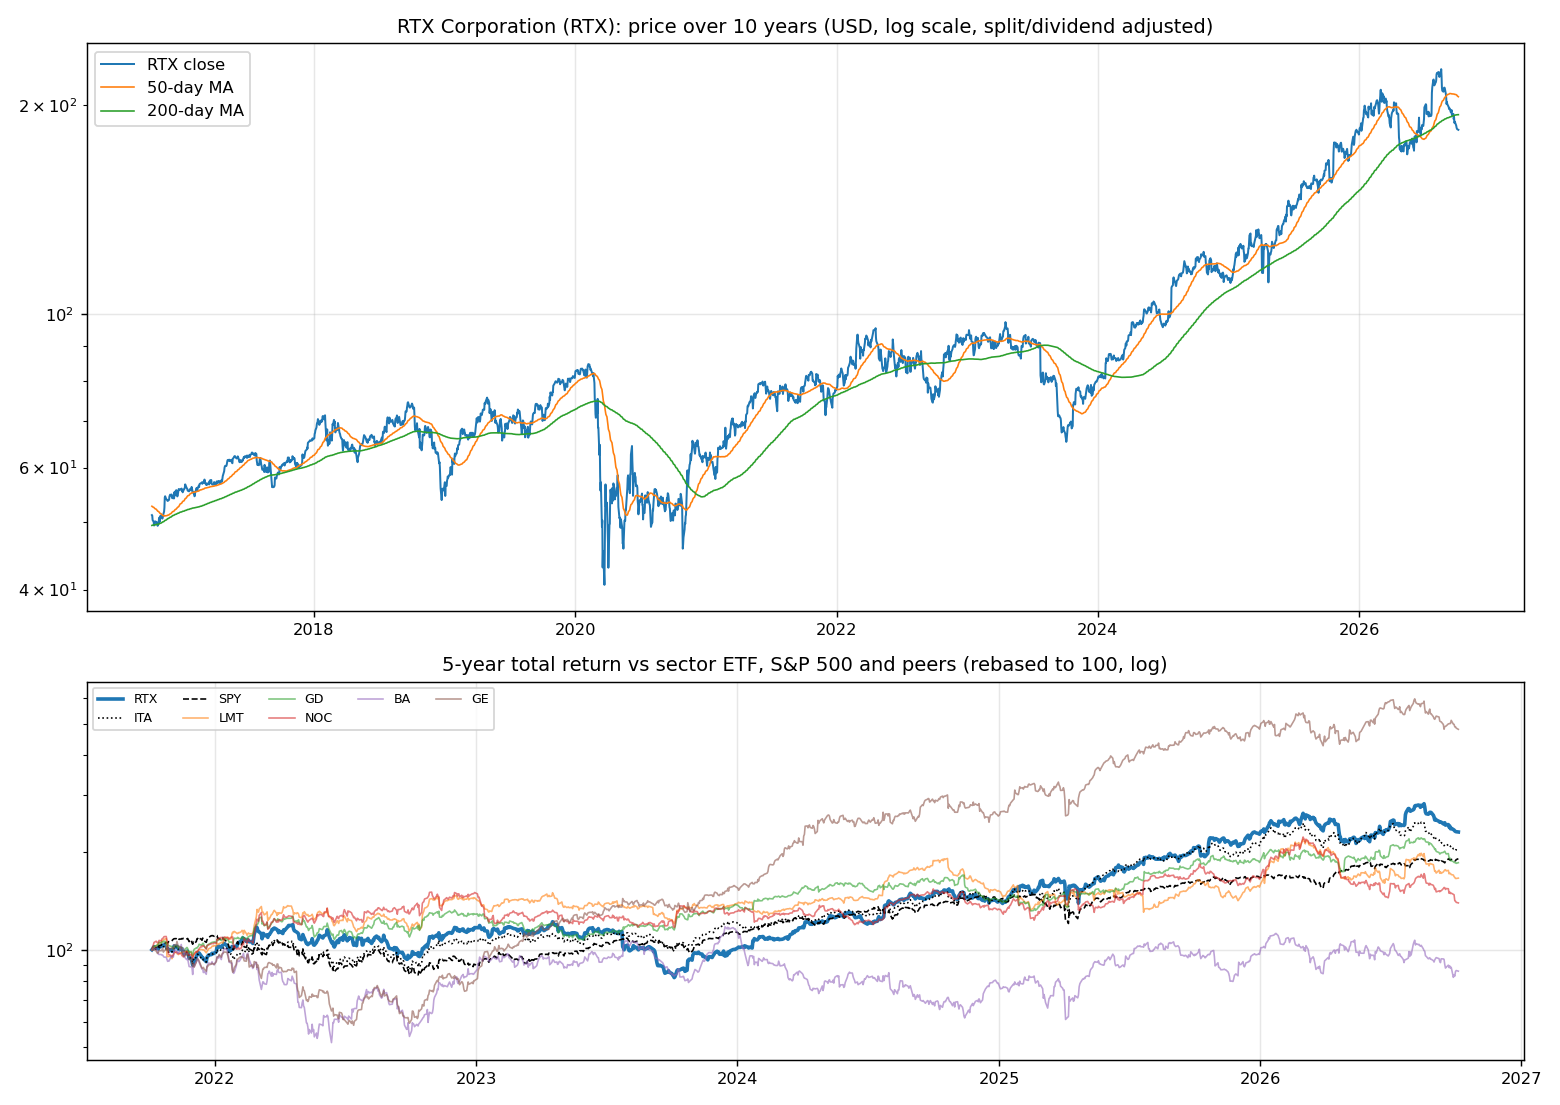
| Ticker | 1M | 3M | 6M | YTD | 1Y | 3Y | 5Y | 10Y | 10Y CAGR |
|---|---|---|---|---|---|---|---|---|---|
| RTX | -8% | -8% | -6% | +2% | +12% | +180% | +131% | +260% | 13.7% |
| ITA | -8% | -17% | -8% | -3% | -1% | +103% | +103% | +253% | 13.5% |
| SPY | +1% | +3% | +18% | +15% | +17% | +87% | +91% | +321% | 15.5% |
| LMT | -4% | -5% | -20% | +7% | +3% | +37% | +67% | +179% | 10.8% |
| GD | -8% | -12% | -5% | -0% | -2% | +59% | +86% | +167% | 10.3% |
| NOC | -8% | -13% | -31% | -15% | -21% | +18% | +40% | +163% | 10.2% |
| BA | -9% | -18% | -9% | -11% | -11% | +3% | -14% | +56% | 4.5% |
| GE | -9% | -19% | +6% | -0% | +4% | +250% | +380% | +141% | 9.2% |
Largest one-day moves in the last 5 years: 25 Jul 2023 -10.2%, 04 Apr 2025 -9.8%, 22 Apr 2025 -9.8%, 11 Sep 2023 -7.9%, 25 Jul 2024 +8.2%.
2. Return and risk (ch.5)
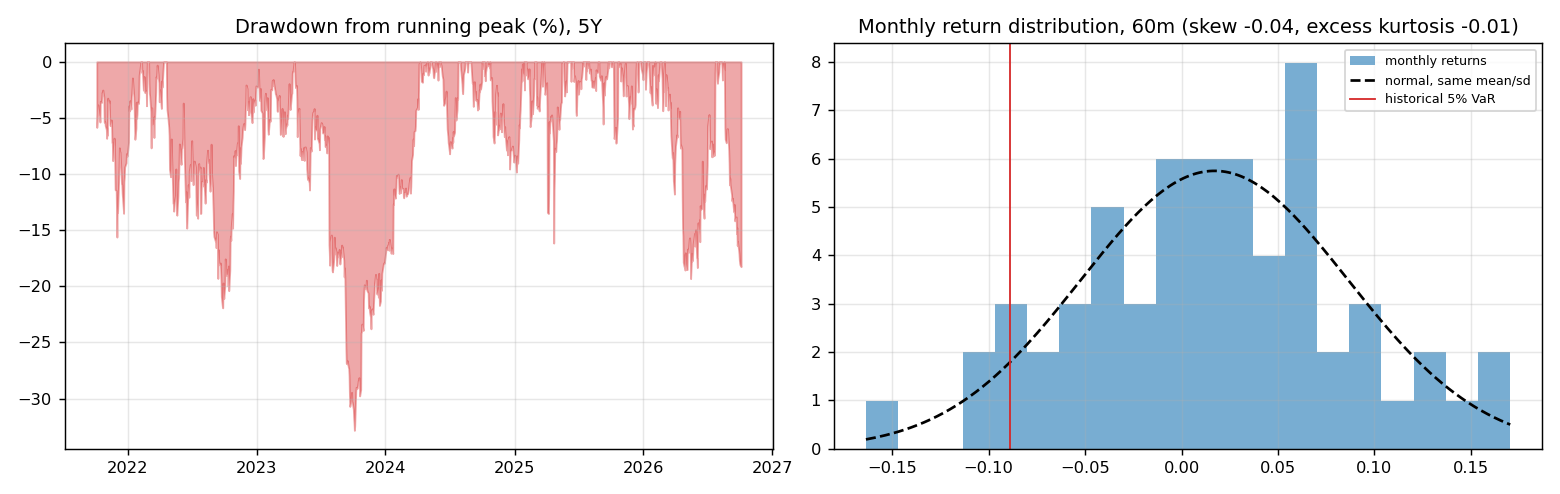
Statistics use the 60 complete months to Sep 2026.
| Statistic | Value | What it means |
|---|---|---|
| Arithmetic mean (annualized) | 20.5% | Expected one-period return if the past repeats |
| Geometric mean (CAGR) | 19.2% | What a buy-and-hold investor actually earned; the gap ≈ σ²/2 is volatility drag |
| Standard deviation (annualized) | 24.0% | 1.5× the S&P 500's 15.7% |
| Skewness / excess kurtosis | -0.04 / -0.01 | Left-skewed, thin tails vs normal |
| 5% monthly VaR: historical / normal | -8.9% / -9.7% | One month in 20 loses at least this much |
| 5% monthly expected shortfall | -12.4% | Average loss in that worst 5% of months |
| Sharpe ratio (S&P 500) | 0.70 (0.67) | Excess return per unit of total risk |
| Sortino ratio | 1.17 | Excess return per unit of downside risk |
| Max drawdown, 5y | -32.8% (trough Oct 2023) | Currently -18.3% from the peak |
3. Index model, CAPM and factors (ch.8–10)
| Regression (60m excess returns) | Alpha (ann.) | t(α) | Beta | t(β) | R² | Residual σ |
|---|---|---|---|---|---|---|
| vs SPY | +13.6% | 1.25 | 0.31 | 1.57 | 0.04 | 23.5% |
| vs ITA | +5.7% | 0.73 | 0.87 | 7.63 | 0.50 | 17.0% |
- Risk decomposition (ch.8): systematic variance β²σ²(M) = 0.2% vs firm-specific σ²(e) = 5.5%, so 4% of the risk is market-driven and 96% is diversifiable.
- CAPM required return (ch.9): k = r_f + β × MRP = 4.02% + 0.31 × 5.5% = 5.7% (Blume-adjusted β 0.54 → 7.0%, used as the DCF discount rate).
- Historical alpha of +13.6% a year has a t-stat of 1.25: not statistically distinguishable from zero (ch.11: past alpha is a weak guide).
- Fama-French 5 factors + momentum (ch.10, 150 months to Jul 2026): R² 0.42, alpha +1.8% (t 0.33). Loadings: Mkt-RF +0.82 (t 7.2), SMB +0.10 (t 0.5), HML +0.43 (t 2.4), RMW +0.44 (t 2.0), CMA +0.16 (t 0.6), Mom -0.18 (t -1.4). The loadings describe a size-neutral, value, high-profitability return profile (SMB > 0 small-cap, HML < 0 growth, RMW < 0 weak profitability, CMA < 0 aggressive investment).
4. Portfolio fit: allocation and diversification (ch.6–7)
Correlation of monthly returns with RTX (60m): ITA 0.71, SPY 0.20, LMT 0.61, GD 0.66, NOC 0.55, BA 0.20, GE 0.42.
- A 50/50 mix with SPY would have had volatility of 15.6% vs 19.9% for the weighted average of the two, a diversification benefit because ρ = 0.20 < 1.
- Optimal risky share y* = [E(r) − r_f] / (A·σ²), holding RTX alone against T-bills (σ = 24.0%):
| Risk aversion A | y* with CAPM E(r) | y* with E(r) + Street α |
|---|---|---|
| 2 | 15% | 39% |
| 3 | 10% | 26% |
| 4 | 7% | 20% |
| 6 | 5% | 13% |
Even a risk-tolerant investor would put only a modest share in a single stock this volatile. Ch.7–8 say the efficient choice is the market portfolio plus a Treynor-Black tilt (section 9), not a concentrated position.
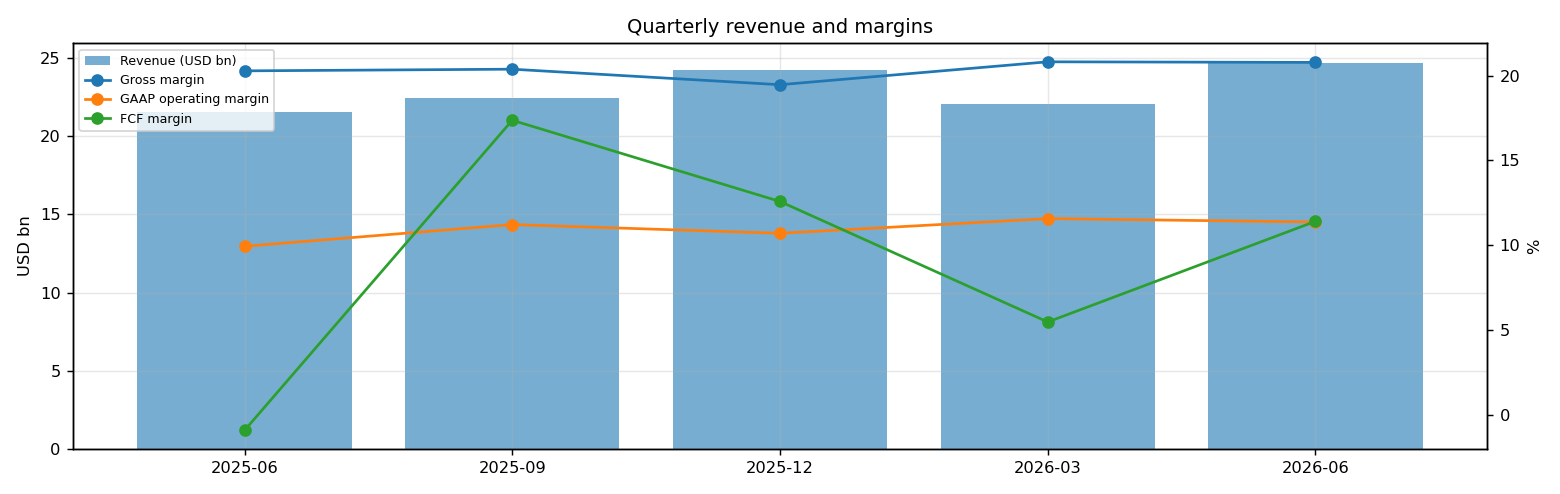
5. Financial statements: quality of earnings (ch.19)
| Quarter | Revenue | Q/Q | Gross m. | Op. m. (GAAP) | Net m. | R&D % | SBC % | Diluted EPS | FCF | FCF m. | DSO (days) | DIO (days) |
|---|---|---|---|---|---|---|---|---|---|---|---|---|
| 2025-06 | 21.6bn | n/a | 20.3% | 9.9% | 7.7% | 3.2% | 1.2% | 1.22 | -0.19bn | -0.9% | 52 | 74 |
| 2025-09 | 22.5bn | +4% | 20.4% | 11.2% | 8.5% | 3.0% | 1.1% | 1.41 | 3.90bn | 17.4% | 52 | 70 |
| 2025-12 | 24.2bn | +8% | 19.5% | 10.7% | 6.7% | 3.3% | 1.3% | 1.19 | 3.05bn | 12.6% | 55 | 62 |
| 2026-03 | 22.1bn | -9% | 20.8% | 11.6% | 9.3% | 2.8% | 1.5% | 1.51 | 1.21bn | 5.5% | 53 | 74 |
| 2026-06 | 24.7bn | +12% | 20.8% | 11.4% | 8.7% | 2.9% | 1.3% | 1.57 | 2.82bn | 11.4% | 51 | 67 |
- DuPont, TTM: ROE 11.9% = net margin 8.3% × asset turnover 0.55 × leverage 2.62. Relative to typical levels (10% margin, 0.8 turnover, 2.0 leverage) the biggest driver is leverage, so part of the ROE comes from financial risk rather than operations.
- Cash conversion: TTM operating cash flow 14.2bn vs net income 7.7bn. The accruals ratio of -3.8% of assets is negative (cash earnings exceed accounting earnings), a sign of high-quality earnings.
- Stock-based compensation of 1.2bn TTM (1.3% of revenue) is a real cost to shareholders. The valuation below uses FCF after SBC (owner FCF margin 10.5%). Buybacks were -0.0bn; share count changed +0.7% over the year.
- Operating leverage (ch.17): degree of operating leverage 4.34 (last two fiscal years): each 1% change in sales moved EBIT by about 4.3%.
6. Valuation (ch.18)
Multiples vs peers (Yahoo Finance, TTM and next-year; peers chosen by hand in config.json):
| Ticker | Fwd P/E | P/S TTM | EV/EBITDA | FCF yield | Rev. growth FY | Gross m. | EBIT m. | ROE TTM | Target upside |
|---|---|---|---|---|---|---|---|---|---|
| RTX | 23.5x | 2.7x | 17.7x | 4% | 14% | 20% | 13% | 12% | 27% |
| LMT | 15.5x | 1.5x | 13.8x | 5% | 10% | 12% | 12% | 89% | 26% |
| GD | 17.8x | 1.6x | 14.3x | 5% | 8% | 15% | 10% | 18% | 27% |
| NOC | 15.6x | 1.6x | 11.4x | 4% | 5% | 20% | 12% | 27% | 34% |
| BA | 46.9x | 1.6x | -62.6x | 4% | 8% | 5% | 0% | 174% | 42% |
| GE | 33.8x | 6.3x | 28.6x | 2% | 21% | 31% | 21% | 48% | 30% |
| Peer median | 17.8x | 1.6x | 13.8x | 4% | 8% | 15% | 12% | 48% | 30% |
Growth embedded in the price (PVGO). With FY2027E EPS of USD 7.86 and k = 7.0%, the no-growth value E₁/k is USD 112.37. PVGO = USD 71.96, which is 39% of the price, so the price leans mostly on existing earnings power. No-growth P/E = 1/k = 14.3x vs the actual 23.5x.
Constant-growth check. On TTM owner FCF, P = FCF₁/(k − g) implies a perpetual growth rate of 3.3%, below the 4% long-run nominal-GDP ceiling the book recommends for g.
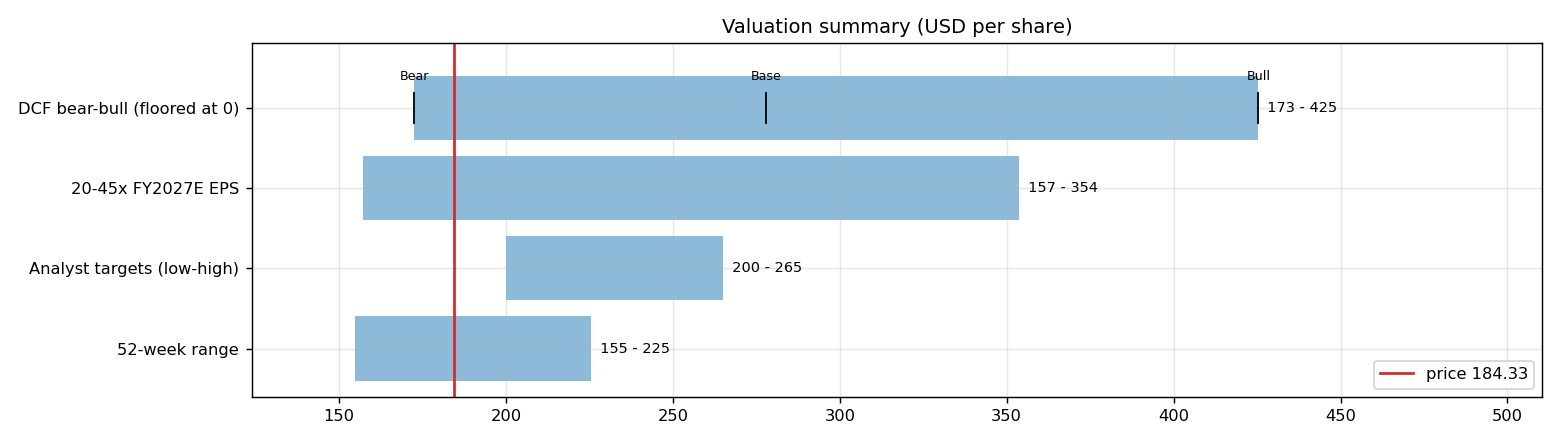
Scenario DCF (owner FCF, k = 7.0%, terminal g = 4%). The revenue path is FY2026 (96.2bn), then the FY2027 low/avg/high estimate, then growth that fades linearly to 4% over 8 years. Owner-FCF margin ramps from today's 10.5% to the scenario margin over 3 years. Scenario assumptions are generic (derived from consensus growth and today's owner-FCF margin).
| Scenario | FY2027 revenue | Growth after | Owner-FCF margin | FY2035 revenue | Terminal value share | Value / share | vs price |
|---|---|---|---|---|---|---|---|
| Bear | 100.1bn | 3% | 8% | 132bn | 77% | USD 173 | -6% |
| Base | 103.3bn | 6% | 10% | 157bn | 78% | USD 278 | +51% |
| Bull | 107.8bn | 10% | 13% | 190bn | 79% | USD 425 | +131% |
Reverse DCF: what today's price assumes. On the base revenue path the price requires a steady-state owner-FCF margin of 7%. At the base 10% margin it requires -3% growth after FY2027, or a discount rate of 8.3% (vs the model's 7.0%).
Sensitivity: base revenue path, value per share by discount rate (rows) and steady-state owner-FCF margin (columns).
| k \ margin | 6% | 8% | 10% | 13% | 15% |
|---|---|---|---|---|---|
| 4.0% | -66,668 | -88,885 | -111,103 | -144,430 | -166,647 |
| 5.0% | 499 | 671 | 842 | 1,099 | 1,270 |
| 6.0% | 239 | 323 | 408 | 535 | 619 |
| 7.0% | 152 | 208 | 264 | 348 | 404 |
| 8.0% | 109 | 151 | 192 | 254 | 296 |
Earnings-multiple cross-check: FY2027E EPS USD 7.86 × 20x = 157, 25x = 196, 30x = 236, 35x = 275, 40x = 314, 45x = 354. The price implies 23x. The FY2027 EPS range across analysts is 7.33–8.24.
7. Market efficiency and earnings reactions (ch.11)
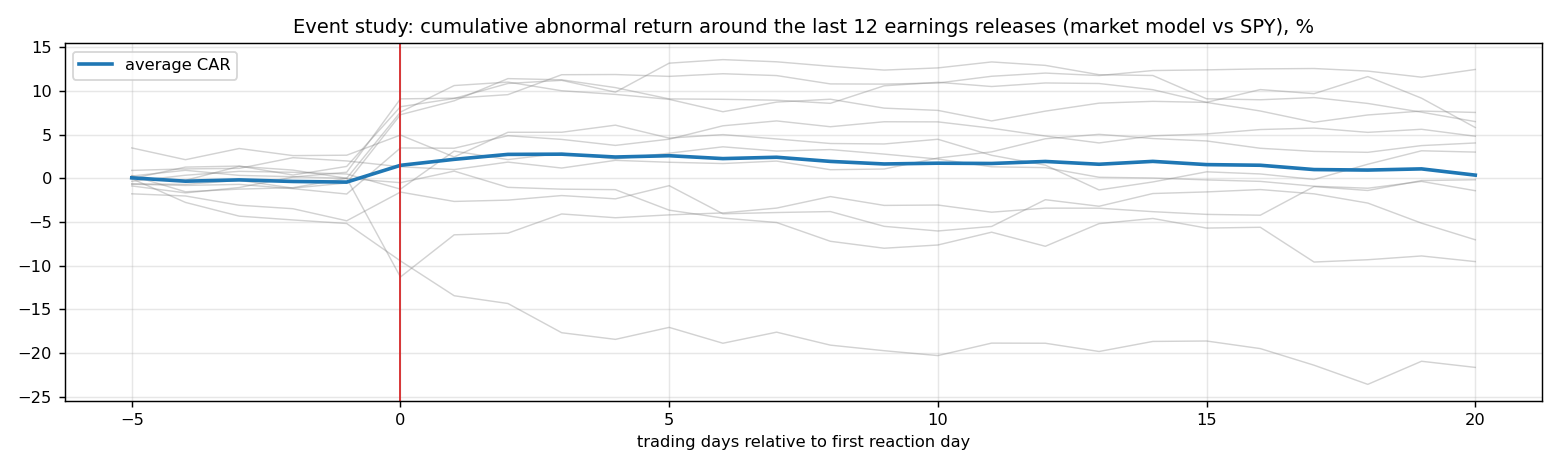
Market-model abnormal returns (vs SPY, estimated over the 250 days before each event) for the last 12 releases:
| Announced | Reaction day | EPS vs est. | Surprise | AR day 0 | CAR [−1,+1] | Drift CAR [+2,+20] |
|---|---|---|---|---|---|---|
| 2026-07-23 | 2026-07-23 | 1.89 vs 1.66 | 13.7% | +7.8% | +10.0% | -3.1% |
| 2026-04-21 | 2026-04-21 | 1.78 vs 1.52 | 16.9% | -4.3% | -8.7% | -8.2% |
| 2026-01-27 | 2026-01-27 | 1.55 vs 1.47 | 5.3% | +3.3% | +0.8% | -4.4% |
| 2025-10-21 | 2025-10-21 | 1.70 vs 1.41 | 20.6% | +7.6% | +11.7% | -3.1% |
| 2025-07-22 | 2025-07-22 | 1.56 vs 1.43 | 9.5% | -1.7% | +2.4% | -4.5% |
| 2025-04-22 | 2025-04-22 | 1.47 vs 1.37 | 7.5% | -11.3% | -7.4% | +6.3% |
| 2025-01-28 | 2025-01-28 | 1.54 vs 1.38 | 11.8% | +2.3% | -0.2% | +0.6% |
| 2024-10-22 | 2024-10-22 | 1.45 vs 1.34 | 8.3% | -0.5% | +0.6% | -10.4% |
| 2024-07-25 | 2024-07-25 | 1.41 vs 1.30 | 8.6% | +8.4% | +9.0% | +3.3% |
| 2024-04-23 | 2024-04-23 | 1.34 vs 1.23 | 8.6% | -0.7% | -1.4% | +3.0% |
| 2024-01-23 | 2024-01-23 | 1.29 vs 1.25 | 3.5% | +5.3% | +4.6% | +1.4% |
| 2023-10-24 | 2023-10-24 | 1.25 vs 1.22 | 2.6% | +6.8% | +8.8% | -2.6% |
- Average absolute day-0 abnormal move: 5.0%. The sign of the EPS surprise matched the sign of the reaction 58% of the time, which is close to a coin flip: guidance and commentary matter more than the headline EPS beat.
- Post-announcement drift: the correlation between the initial reaction and the next-20-day drift is 0.00. There is no reliable post-earnings drift, consistent with semi-strong efficiency.
8. Technicals and behavioural signals (ch.12)
| Indicator | Value | Read |
|---|---|---|
| Price vs 50-day / 200-day MA | -10% / -5% | Golden cross (50 > 200) |
| RSI(14) | 24 | Oversold (<30) |
| 12-1 month momentum | +23% | Positive (Jegadeesh-Titman) |
| 6-month relative strength vs ITA | +2% | Leader |
| Insider sales / purchases, last 6m | USD 0.01bn / USD 0.00bn | Net selling, often planned 10b5-1 sales; insider buying is the informative signal (ch.11) |
| Analyst actions, last 90 days | 7 actions, 6 target raises | Targets chasing the price is a sign of anchoring and herding (ch.12) |
| Recent targets below current price | 0% | Most targets still sit above the price |
| Ratings (strong buy / buy / hold / sell) | 5 / 11 / 7 / 0 | Mixed views: less crowded positioning |
| FY2027 EPS estimate: now vs 90 days ago | 7.86 vs 7.58 | +4% revision; up/down revisions in the last 30 days: 1/2 |
9. Treynor-Black: should an active manager overweight it? (ch.27)
| Step | Value |
|---|---|
| Analyst-implied 12m return (mean target / price − 1) | +27.0% |
| CAPM 1-year required return (raw β) | 5.7% |
| Raw alpha | +21.3% |
| Minus average analyst optimism bias (Top-30 cross-section) | -9.9% |
| Shrunk alpha (× 0.25, for forecast imprecision) | +2.8% |
| Residual variance σ²(e) | 5.5% |
| Initial active weight w₀ = [α/σ²(e)] / [E(R_M)/σ²_M] | +22.9% |
| Beta-adjusted weight w* = w₀ / [1 + (1 − β)w₀] | +19.8% |
A positive weight means an active manager would hold more than its index weight.
10. Options market view (ch.20–21)
| Expiry | Days | ATM IV | Implied ±1σ move to expiry | 90% put − 110% call IV (skew) |
|---|---|---|---|---|
| 2026-10-16 | 11 | 24% | ±4.1% (±8) | +8.7% |
| 2026-10-23 | 18 | 37% | ±8.1% (±15) | +2.3% |
| 2026-10-30 | 25 | 32% | ±8.5% (±16) | +4.1% |
| 2026-11-06 | 32 | 35% | ±10.3% (±19) | -3.5% |
| 2026-11-13 | 39 | 30% | ±9.8% (±18) | -0.1% |
| 2026-11-20 | 46 | 29% | ±10.5% (±19) | +3.1% |
| 2026-12-18 | 74 | 27% | ±12.3% (±23) | +3.0% |
| 2027-01-15 | 102 | 27% | ±14.3% (±26) | +1.5% |
| 2027-02-19 | 137 | 28% | ±17.2% (±32) | +2.6% |
| 2027-03-19 | 165 | 28% | ±19.0% (±35) | +2.3% |
| 2027-05-21 | 228 | 30% | ±23.4% (±43) | +0.1% |
| 2027-06-17 | 255 | 29% | ±23.9% (±44) | +2.9% |
| 2027-09-17 | 347 | 28% | ±27.7% (±51) | +2.8% |
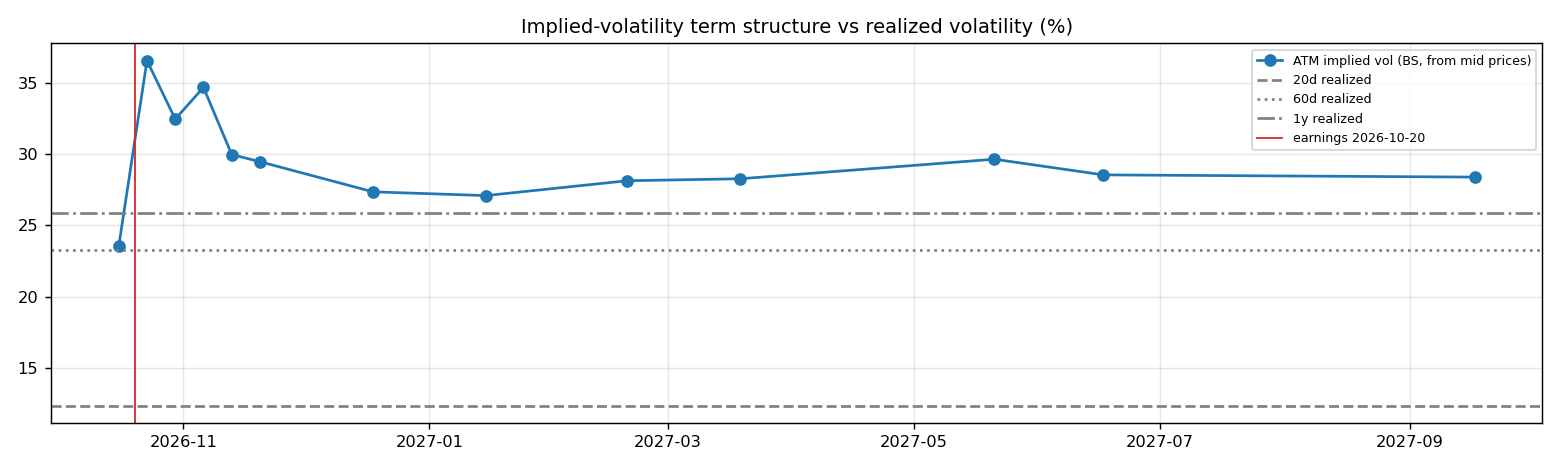
- Earnings-implied move: the jump in variance from the 2026-10-16 expiry (IV 24%) to 2026-10-23 (IV 37%) prices an earnings-day move of ±6.2% (1σ), or about ±5.0% in absolute terms (≈ ±9). Compare the historical average absolute reaction of 5.0% in section 7.
- Implied vs realized: the ~1-month ATM IV is 35% vs realized 12% (20d) / 23% (60d) / 26% (1y). Options are rich relative to realized volatility, which favours premium sellers (covered calls, cash-secured puts).
- Put-call parity (ch.20): at the ATM strike for 2026-11-06, C − P − (S − PV(K)) = +0.72 per share. Close to zero, as parity requires.
- Quotes were unavailable when the data was pulled (outside market hours), so implied vols use each contract's last trade price. Treat them as approximate; illiquid strikes can be stale.
Premium-selling menu for holders: the last expiry before earnings (2026-10-16), about 0.15/0.20/0.25/0.30 delta.
| Type | Strike | Bid / Ask | Price | IV | Delta | P(expires OTM) | Distance | Yield | Annualized | OI |
|---|---|---|---|---|---|---|---|---|---|---|
| Call | 190 | – | 1.03 | 23% | +0.24 | 77% | +3.1% | 0.56% | 19% | – |
| Call | 192 | – | 0.60 | 24% | +0.16 | 85% | +4.4% | 0.33% | 11% | – |
| Put | 178 | – | 0.69 | 24% | -0.17 | 82% | -3.7% | 0.39% | 13% | – |
| Put | 180 | – | 1.26 | 24% | -0.27 | 72% | -2.3% | 0.70% | 23% | – |
Calls = covered calls on shares you own (yield on the share price); puts = cash-secured puts (yield on the strike). Prices are last trades at the data pull and indicative only; check live quotes before trading.
11. Our hourly signal model
RTX is not in the Top-30 signal universe.
12. Qualitative analysis: business, PEST, catalysts and risks
Qualitative notes reviewed 2026-10-06
These notes are written by hand, unlike the auto-refreshed numbers above. Events up to late 2025 come from company announcements. Later developments are inferred from the data (consensus estimates, price reactions) and should be checked against RTX's 10-Q/10-K filings and earnings calls.
Business in one paragraph
RTX is a defense and aerospace conglomerate with three main businesses: Collins Aerospace, Pratt & Whitney and Raytheon. Collins sells aircraft systems, avionics, interiors and aftermarket support; Pratt sells and services commercial and military engines; Raytheon supplies missiles, radars, air defense, sensors and command systems. Revenue is driven by commercial aero build rates, aftermarket shop visits, defense budgets and long-cycle programs. The investment case hinges on resolving Pratt's geared turbofan powder-metal issue while converting strong defense and commercial aerospace demand into cash flow.
Key developments
| When | Event | Why it matters |
|---|---|---|
| Sep 2023 | RTX disclosed a powder-metal manufacturing issue affecting certain Pratt GTF engine parts and took a large charge. | Created multi-year cash, margin and customer-compensation risk. |
| 2024 | RTX increased inspection, repair and spare-parts capacity for GTF customers. | Execution on removals and shop visits is the main path to restoring Pratt credibility. |
| 2024-2025 | Global demand for air defense, missiles and sensors remained elevated. | Raytheon backlog benefits from NATO replenishment, Ukraine lessons and Indo-Pacific deterrence. |
| 2025 | Pratt reported strong GTF order activity and progress toward GTF Advantage service entry. | Shows airlines still value fuel efficiency despite durability issues. |
| 2025 | Collins and Pratt aftermarket demand stayed supported by rising flight hours. | Aftermarket mix is important for margin recovery and cash generation. |
PEST analysis
| Factor | Tailwinds | Headwinds | Net |
|---|---|---|---|
| Political | NATO rearmament, missile-defense demand and US defense priorities support Raytheon. Export approvals can open allied sales. | Defense budgets are political; contract protests, export limits and government shutdowns can delay awards. | ✅ |
| Economic | Commercial flight hours, narrowbody production and aftermarket shop visits support Collins and Pratt. | Inflation, supplier shortages and fixed-price defense contracts can pressure margins and working capital. | ⚖️ |
| Social | Airlines need fuel-efficient engines, and governments prioritize air defense after recent conflicts. | Engine reliability issues damage airline trust; defense exposure attracts ESG exclusions for some investors. | ⚖️ |
| Technological | GTF architecture, advanced sensors, missiles, radars and avionics are high-barrier markets. | Durability problems, hypersonic competition, software complexity and supply-chain quality can erode advantage. | ⚖️ |
Bull case vs bear case
- Bull: GTF removals and compensation peak, aftermarket volumes rise, defense backlog converts, and RTX restores confidence in Pratt while Collins compounds with air traffic. The portfolio then offers a balanced commercial-defense recovery with improving cash flow.
- Bear: GTF costs run longer, supplier constraints delay deliveries, fixed-price defense programs pressure margins, and airlines demand more concessions. If powder-metal remediation keeps absorbing cash, defense strength may not fully show up in per-share results.
Catalysts to watch (next 6–12 months)
- Updates on GTF inspections, removals, customer compensation and shop-visit capacity.
- Free cash flow conversion versus earnings as remediation spending continues.
- Defense bookings for missiles, air defense and sensors.
- Collins aftermarket growth and commercial aircraft production rates.
- Any changes to defense budgets, export approvals or fixed-price program charges.
What would change the verdict
- More constructive: evidence that GTF cash costs are tracking below plan, Raytheon margins stabilize, and aftermarket growth converts to free cash flow.
- More cautious: additional engine charges, supplier quality problems, major fixed-price write-downs, or a slowdown in aircraft utilization.
Generated by analyses/deep-dives/deep_dive.py. Quantitative sections refresh weekly; the qualitative notes carry their own review date.